
Learning how to read the financial page in a newspaper is easy if you know the purpose of each column. Once you know how to read the financial page, doing research and following the value of stocks, bonds and mutual funds is easier and much more informative.
The tables for stocks, bonds and mutual funds are very different. Each type of table has specific information related to that in- vestment vehicle.
Stock Market Tables
Stock market tables are arranged alphabetically by the name or symbol of the company issuing stock. Most stocks are traded on either the New York Stock Exchange or Nasdaq. If you don’t find the company you are looking for on one exchange table, look for it on the other. Remember that not all companies are publicly traded. Some companies have privately held stock. Only publicly traded stock appears on the stock exchange tables.
The far left-hand column of a stock market table usually has the heading “52 Weeks.” Underneath it are two columns of numbers with the headings “Hi” and “Lo.” These two columns refer to the highest and lowest price that this stock traded for in the past year (52 weeks) plus the current week.
The next column gives the name of the company. The heading for this column is labeled “Stock.” In the above example, the name of the company is “General Electric.” The “Stock” column is followed by a column labeled “Sym.” This column contains the symbol that is used to trade this stock on the stock exchange. In the above example, the symbol is “GE.”
Occasionally, the shortened title for a company and its symbol are difficult to locate. In that case, you may have to consult another resource to find out a company’s name and symbol for the stock exchange. Often, a company stock is traded under a parent company and not under the name by which you know it.
All of the previously mentioned information is followed by several columns of numbers. The column following the company symbol provides information on the annual dividend (in dollars) for a share of stock for this company. The column is headed by “Div.” The amount is based on the latest company statement. Companies pay dividends at different times. They may be paid monthly, quarterly, semiannually or annually. Other disbursements are usually marked by a footnote.
The column following the dividend information is marked “Yld%.” The number in this column represents the total annual dividends paid by the company expressed as a percentage of the price of the stock.
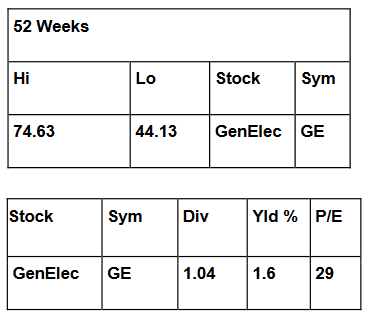
In the past year, General Electric has disbursed dividends of $1.04 per share. This represents a yield of 1.6% of the price of the stock. The current price of this stock was $66.88. The yield was obtained by dividing the dividends ($1.04) by the current price ($66.88).
The next column is another important column in evaluating a stock. It represents the “P/E,” or price-to-earnings ratio, of the stock. The number in this column is obtained by dividing the last closing price per share by the company’s per-share earn-ings for the previous four quarters. The earnings numbers are obtained from company quarterly financial statements.
The P/E provides a measure of how much you would have to pay for a $1 share of the company’s profit. The P/E number is one that is useful when comparing one stock to another and when comparing the value of one stock over time. More details on this can be found at theconversation.com.
The last four columns of numbers refer to the previous daily activity of each stock. At times, the stock table in your newspaper may pertain to another day. If so, it will state the date of the information. These columns give (in order) the number of shares traded, the highest price per share, the lowest price per share, the last price per share (closing), and the net change from the previous day.
Bonds
Tables for corporate bonds have the following columns: company name or symbol, the current yield as percent interest paid on the bond, volume of bonds traded, the closing price and the net change.
Mutual Fund Tables
As with the stock market tables, iisd.org notes that the mutual fund tables are arranged alphabetically by the name of the company selling the mutual fund. Each company has several mutual funds. Following the company name will be another alphabetical list of the mutual funds for that company. Some companies are listed more than once. To find your mutual fund, you will need to know the company and the name of the fund for that company.
Some companies have as many as eight to 10 groups of mutual funds. Within one group, some companies have more than 50 different mutual funds listed. Occasionally, the financial table for mutual funds will include additional columns. The additional columns provide percent return information for other time periods, such as the previous four weeks, the last 12 months, the last three years, and the last five years. These figures help the reader understand more about how the value of this fund changes.
Mutual funds have expenses associated with them. Some days this information is printed in the financial table along with the sales commission costs for each fund. Both of these figures are presented as percentages .